Tag: Oracle
Why my new Disk Group is not getting mounted automatically when ASM instance starts?
ORA-15097: cannot SHUTDOWN ASM instance with connected client
Cleanup After Failed Installation Oracle Clusterware 11gR2
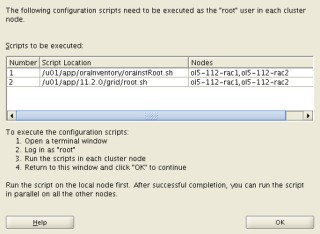
In this blog I will talk about how to cleanup a failed installation of the Oracle Clusterware 11gR2 in one particular node. I was installing the new Oracle Clusterware 11.2.0.1 in my home lab by follwing Tom Kyte’s instructions (http://www.oracle-base.com/articles/11g/oracle-db-11gr2-rac-installation-on-oel5-using-virtualbox.php#install_grid_infrastructure), then went through the part that the installer GUI needs us to run the root.sh scripts.
The easy thought was to run the root.sh script in both nodes of my RAC (RAC1 & RAC2) at the same time, without reading the explicit instructions “Run the script on the local node first. After successful completion, you can run the script in parallel on all other nodes.”:
The script run successful in the RAC1 node but in the RAC2 node. So when the script finished in RAC1 tried to run it again in RAC2, but the same results “the output was that the script was already ran”.
What to do next?, do I have to start over from scratch?
Surfing the web found a good & useful article from Guenadi Jilevski (http://gjilevski.com/2010/08/12/how-to-clean-up-after-a-failed-11g-crs-install-what-is-new-in-11g-r2-2/), here shows how to perform a manual cleanup in 11gR1, but also shows the new features and scripts in 11gR2.
Summarized steps:
Deconfigure Oracle Clusterware 11.2.x.x without removing the binaries:
- Log in as root user on the node you encountered the error. Change directory to $GRID_HOME/crs/install.
- Run rootcrs.pl with the -deconfig -force flags on the node you have the issue.
- If you are deconfiguring Oracle Clusterware on all the nodes in the cluster, then you have to add the -lastnode flag on the last one in order to deconfigure OCR and Voting disks.
Historical SQL Statistics And Execution Plan Change
How many times have you received user’s phone call stating that the DB is slow?, well sometimes this has nothing to do with the DB’s overall performance itself, but with a user’s query.
Now the question is, is this query really slow?, the best way to find this out is comparing the actual execution time with the ones in the past. Here’s a SQL statement which search inside AWR repository (Caution!!! a special license is required!!!), it compares the execution plan of all SQL_ID’s against the previous snapshot.
awr_planchanges.sql
prompt enter the number of days in the past to scan
SET LINES 500
SELECT A.SNAP_ID,
BEGIN_INTERVAL_TIME,
SQL_ID,
HASH_VALUE1,
HASH_VALUE2,
VALUE1 as “ELAPSED TIME PER EXEC 1” ,
VALUE2 as “ELAPSED TIME PER EXEC 2”,
ROUND (CHANGE_PERCENT) as “CHANGE PERCENT”
FROM ( SELECT SNAP_ID,
SQL_ID,
SUM (pvalue1) HASH_VALUE1,
SUM (pvalue2) HASH_VALUE2,
SUM (value1) VALUE1,
SUM (value2) VALUE2,
(SUM (VALUE1) + 1) * 100 / (SUM (VALUE2) + 1)
AS CHANGE_PERCENT
FROM (SELECT snap_id,
0 AS snap2,
sql_id,
plan_hash_value AS pvalue1,
0 AS pvalue2,
ROUND (
elapsed_time_delta / executions_delta / 1000000,
3)
AS value1,
0 AS value2
FROM dba_hist_sqlstat sql
WHERE executions_delta > 0
UNION
SELECT snap_id + 1,
snap_id AS snap2,
sql_id,
0 AS pvalue1,
plan_hash_value AS pvalue2,
0 AS vaule,
ROUND (
elapsed_time_delta / executions_delta / 1000000,
3)
AS value2
FROM dba_hist_sqlstat sql
WHERE executions_delta > 0)
GROUP BY SNAP_ID, SQL_ID) A,
dba_hist_snapshot B
WHERE A.SNAP_ID = B.SNAP_ID
AND HASH_VALUE1 > 0
AND HASH_VALUE2 > 0
AND HASH_VALUE1 != HASH_VALUE2
AND BEGIN_INTERVAL_TIME > SYSDATE – (&days)
ORDER BY A.SNAP_ID
/
This is the output of the script:
SNAP_ID BEGIN_INTERVAL_TIME SQL_ID HASH_VALUE1 HASH_VALUE2 SEC PER EXE 1 SEC PER EXE 2 CHANGE %
——– ———————– ————- ———– ———– ————- ————- ——–
9547 01-OCT-12 01.00.07.841 AM 4urszd9dt9fjv 4862331523 891004645 .015 .007 101
9585 02-OCT-12 03.00.41.798 PM 4urszd9dt9fjv 4862331523 891004645 .009 .003 101
9586 02-OCT-12 04.00.36.393 PM 4urszd9dt9fjv 891004645 4862331523 .006 .009 100
9587 02-OCT-12 05.00.25.306 PM 1k30v0pyg32vu 414828074 878600859 .179 .157 102
9587 02-OCT-12 05.00.25.306 PM dsm86bzuqtd2r 2452407222 3005749068 .048 1.37 44
9616 03-OCT-12 10.00.34.499 PM 4urszd9dt9fjv 4862331523 891004645 .018 .023 100
9621 04-OCT-12 03.00.06.979 AM 4urszd9dt9fjv 891004645 4862331523 .03 .027 100
9640 04-OCT-12 09.00.40.250 PM 4urszd9dt9fjv 4862331523 891004645 .042 .012 103
9641 04-OCT-12 10.00.22.954 PM dfmu8nm1cscx7 3810296266 4308029399 .938 .703 114
9710 07-OCT-12 07.00.09.269 PM 4urszd9dt9fjv 4862331523 891004645 .046 .015 103
9750 09-OCT-12 11.00.59.162 AM 1k30v0pyg32vu 1634868183 414828074 .16 .155 100
9758 09-OCT-12 07.00.10.659 PM b70xavb9wv27v 1111647858 4256287279 5.937 6.475 93
12 rows selected.
You can clearly see how the HASH_VALUE changed and the execution time as well. If the CHANGE % is above 100% means that execution time decreased, on the other hand CHANGE % below 100% means the execution time increased.
ORAganism blog is having a really good script which searches by SQL_ID.
http://oraganism.wordpress.com/2011/12/14/a-dba_hist_sqlstat-query-that-i-am-very-fond-of/
Happy troubleshooting,
Alfred
Same post in Spanish here!
